Selecting forecast issue times
Selecting multiple or historical issue times can be helpful to compare forecasts and revisit past flow events. The HydroForecast dashboard enables users to search and view previously issued forecasts.
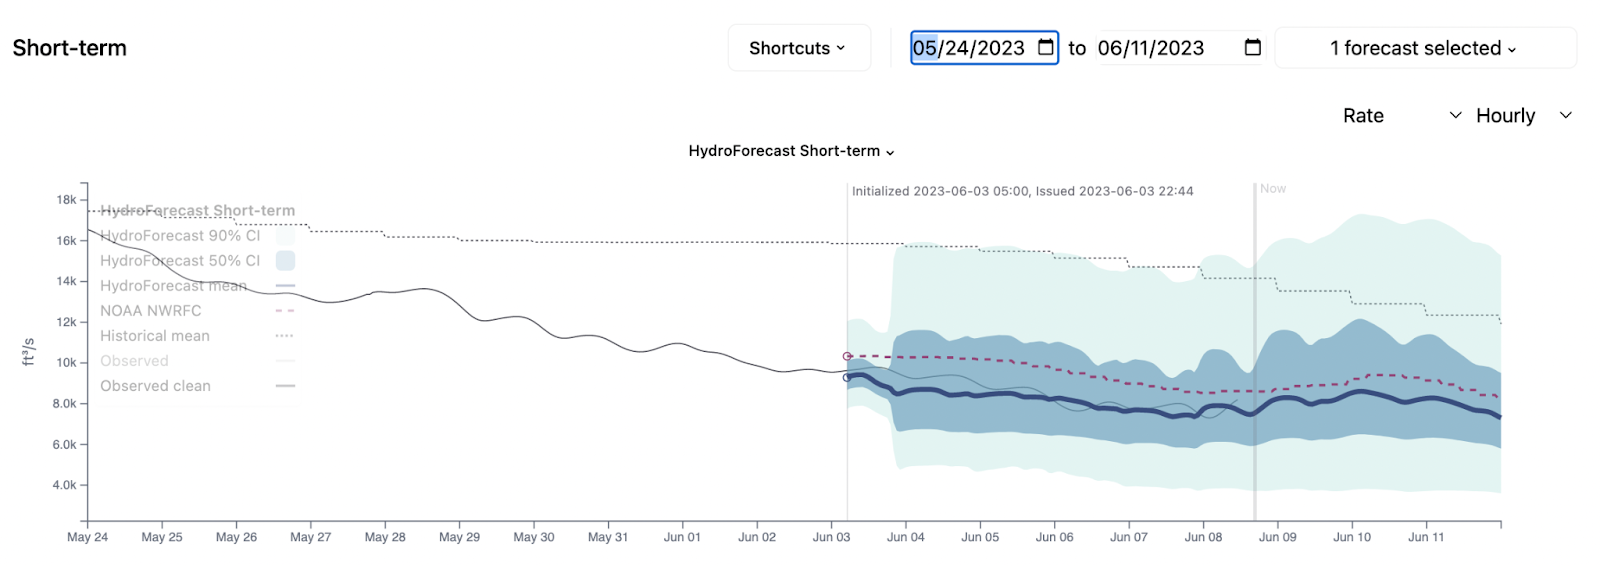
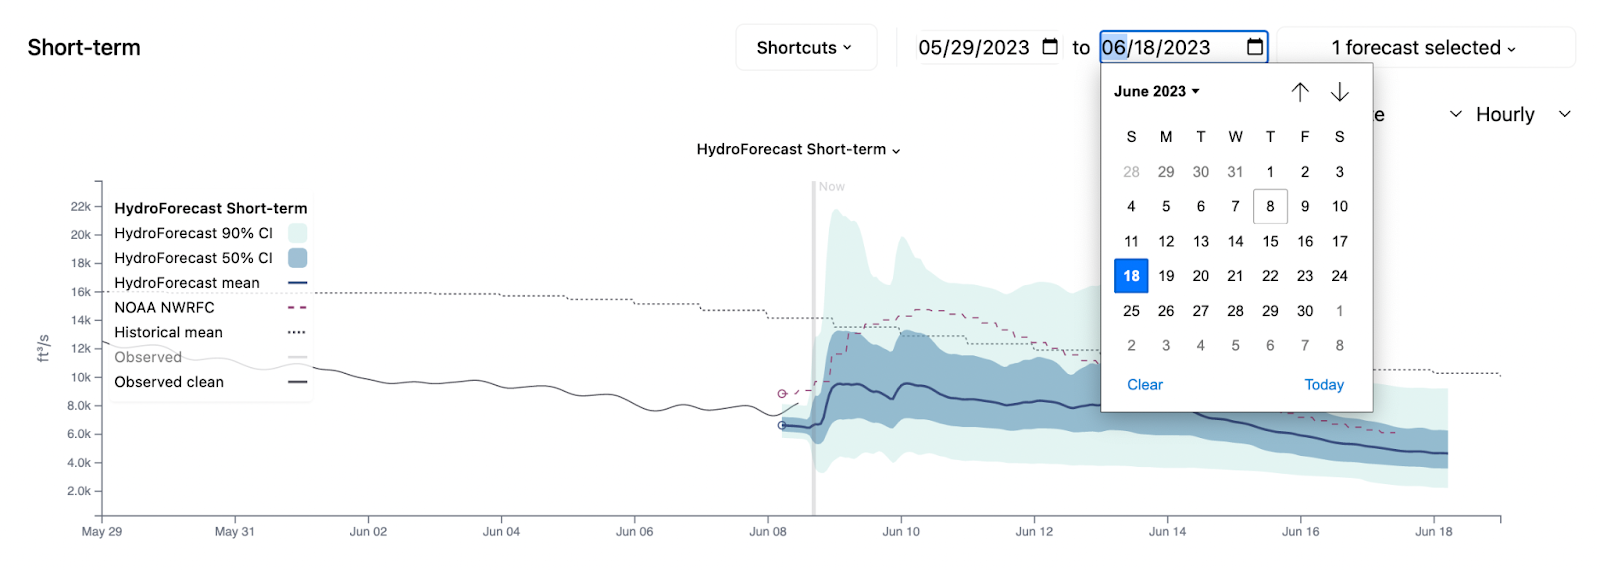
To make a selection you can either use the shortcuts or use the calendar drop downs (start date and end date respectively) to select a time period of interest. This selected time period will control the x-axis of all plots in the section.
The forecast selector dropdown displays all of the available forecasts, listed by their issue time. Check the box next to an issue time to display that forecast on the plots.
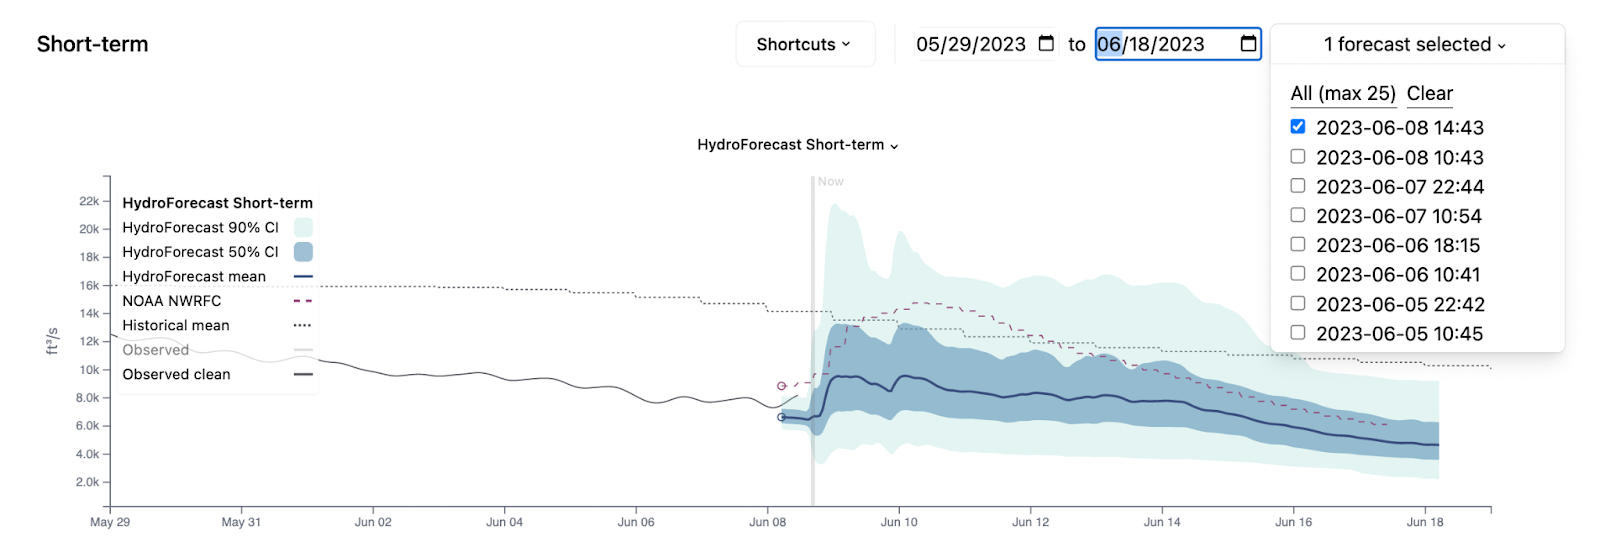
When multiple forecasts are displayed, confidence intervals are hidden for clarity. To show the confidence intervals of a forecast, hover over the circle displayed at its issue time. You can also view both the issue time and the initialization time for a given forecast when you hover over the beginning of the forecast.