Modeling Snowmelt and Freezing Processes
Upstream Tech has significant operational forecasting experience in river systems driven by spring snowmelt. These settings are often complicated by frequent precipitation events near freezing where phase partitioning and rain on snow events become critical factors in the runoff generating processes.
 |
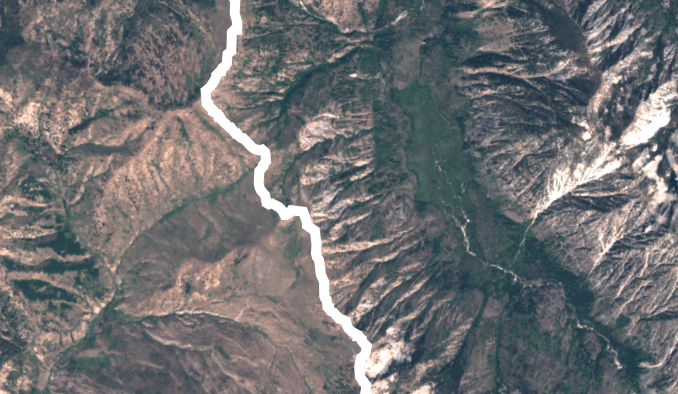 |
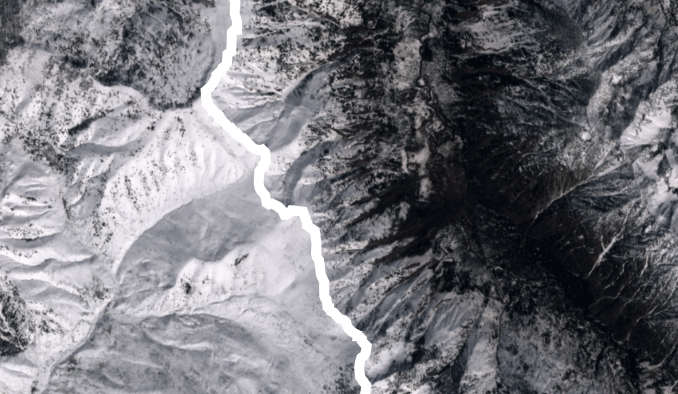
Satellite observations provide near real time information on snow conditions.
HydroForecast™ has been engineered to model the snow, precipitation phase and melt processes which influence runoff by training on datasets containing over 3 million days of input/output data across the continental US (two decades of data across hundreds of basins). This vast observational history allows our models to learn the nuances of how precipitation, air temperature, solar radiation, humidity, elevation, land cover conditions and more interact to ultimately determine the phase (rain or snow) in which precipitation falls and how that precipitation behaves on the land surface.
Temperatures near freezing provide a distinct challenge to models which seek to accurately create probabilistic forecasts. Because our models are explicitly optimized to report their confidence at each forecast step, they are able to learn when forecasted conditions lead to more or less certainty in the prediction and report that by predicting a wider or smaller confidence interval. In contrast, phase partitioning in traditional physical models is nearly always a deterministic process containing no principled method for the model itself to identify and report additional uncertainty caused by near freezing temperatures, which can lead to overconfident forecasts with unrealistically narrow confidence intervals.
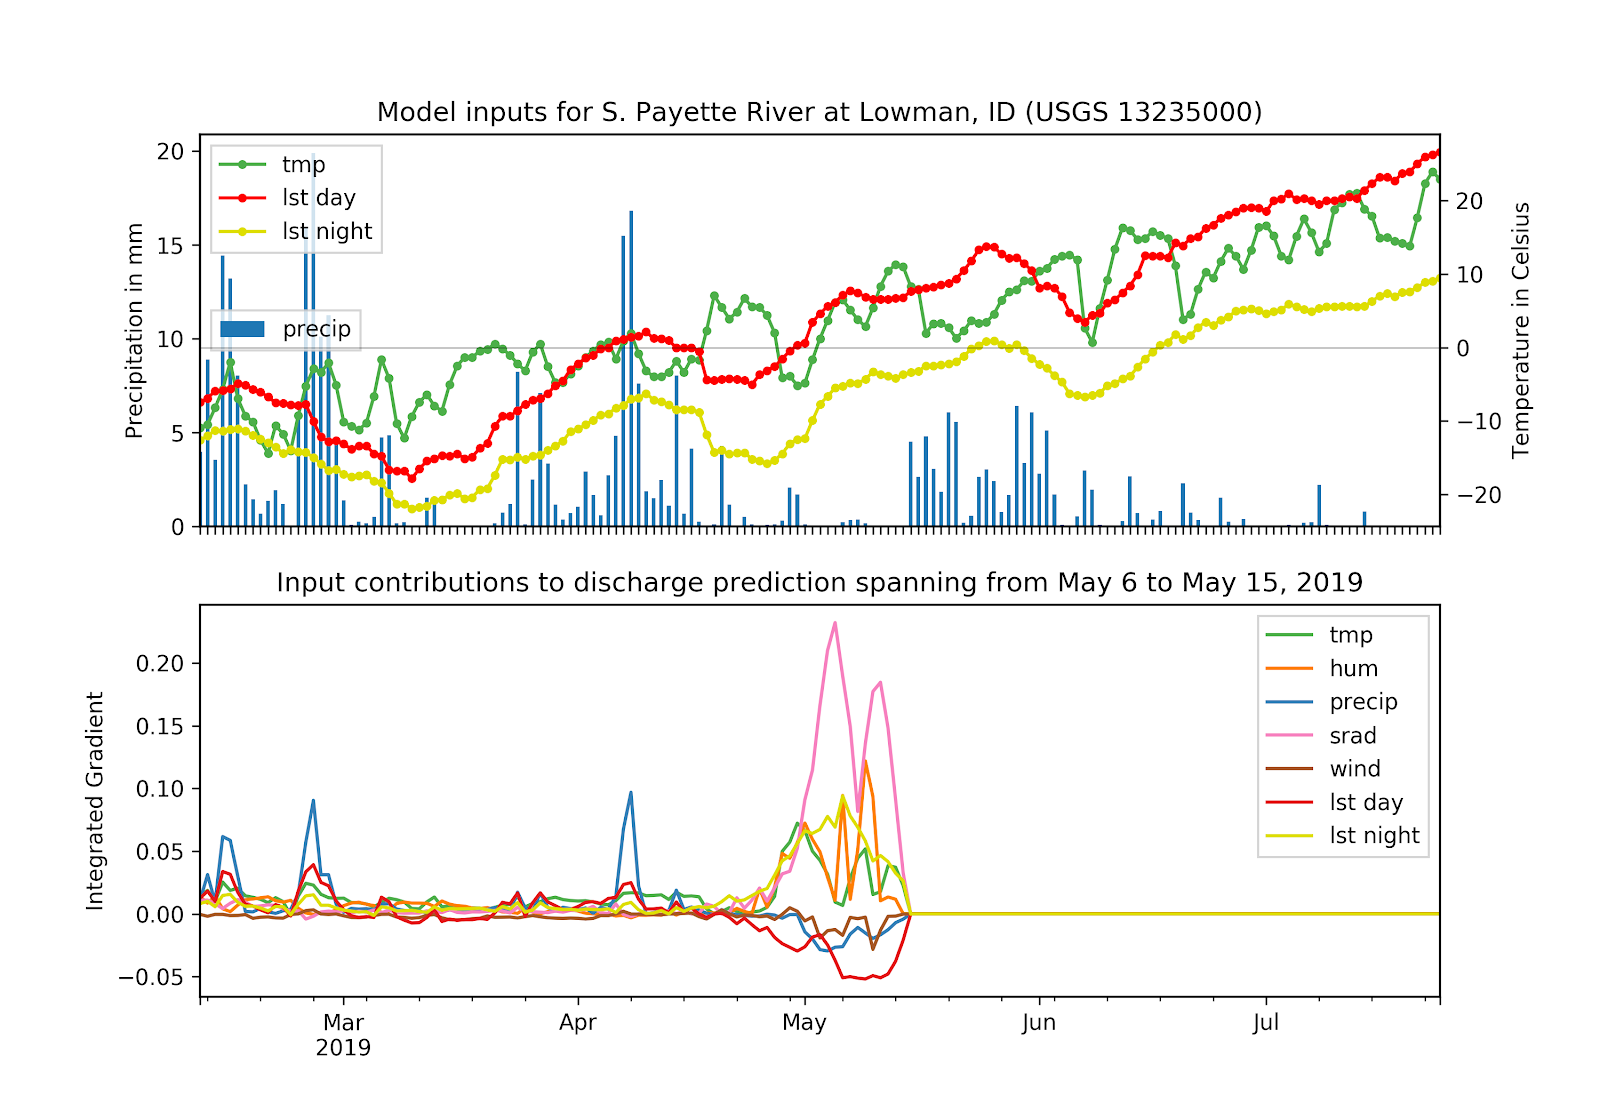
An example of HydroForecast™ modeling freezing and snowmelt processes. The top plot shows a selection of model inputs: air temperature, day and night satellite land surface temperature (lst) observations, and precipitation. The bottom plot describes the direction and magnitude of influence each input from each time step has on the total amount of runoff May 6th to 15th. In the bottom plot we see how early spring precipitation (blue spikes) is accumulated in the model as snow and later melted by solar radiation (pink spikes) and other temperature variables. The modeled runoff (output) is not shown in this plot. This method allows the model to explain which inputs drive the model’s predictions.