Overlays
This article covers:
Overlays are vector data that can be displayed on top of the map in Lens. These can be points, lines, or polygons. We offer a few options in the Overlay Library, and Admins and Members can upload their own custom overlays, such as building envelopes, photo points, trails, and more.
Overlay Library
Every Lens account comes with an Overlays Library with options that can be added to your portfolios. To get there, click here or navigate to the Settings page where you’ll see Overlays beneath the Lens Library. From here, you can check out Featured Overlays. Admins or Members can add these to portfolios. Once added, they’ll appear in the Your Overlays section below, where you can choose which portfolios they should appear in by default.
Here are some of the Overlays we have in the Library now, and would love to hear any ideas you have as we continue adding to this list:
- Parcel Data from Regrid pulls parcel data from across the US directly into Lens, allowing you to easily check tax parcel ownership. This layer is available to our Plus and Enterprise users, and shows the parcel ID, owner, and address on hover.
- Flowlines come from the USGS National Hydrography Dataset for linear surface water drainage network across the US, and can be useful if you’re interested in monitoring areas with streams or rivers
- Microsoft Building Footprints is an open dataset developed by Microsoft Maps and Bing Maps showing building footprints datasets in the US. This dataset contains nearly 130 million computer generated building footprints derived using our computer vision algorithms on satellite imagery.
- Native Land Territories is an open dataset developed by Native Land Digital, an Indigenous-led nonprofit based in Canada. This overlay maps Indigenous territories and is intended to shed light on the history of colonialism, Indigenous ways of knowing, and settler-Indigenous relations. Territories are shown globally where data is available. It does not represent or intend to represent official or legal boundaries of any Indigenous nations. Any conflicting territorial claims err on the side of being more expansive. To learn about definitive boundaries, contact the nations in question, which are linked in the Overlay details on hover.
- Electric Power Transmission Lines: This dataset shows transmission lines for the electric power grid within the continental United States. It is provided by the US Department of Homeland Security Geospatial Management Office's Homeland Infrastructure Foundation-Level Data Portal.
- Natural Gas Pipelines: This dataset includes the major natural gas transmission pipelines in the United States including interstate, intrastate, and gathering pipelines. Data was obtained by the U.S. Energy Information Administration and last updated in June of 2019. It is made available by the U.S. Department of Homeland Security Geospatial Management Office's Homeland Infrastructure Foundation-Level Data portal. Upon hover, you'll see the pipeline operator and type of pipeline (Ex: interstate, intrastate) as context.
- US Protected Areas: This overlay includes protected conservation areas at the national, state and local level as well as easements as of June of 2023. It is derived from the USGS Protected Areas Database of the U.S. (PAD-US) and includes public lands and parks, Wilderness Areas, National Wildlife Refuges, reserves, conservation easements, Marine Protected Areas, and more. This data is provided by the U.S. Department of Homeland Security Geospatial Management Office's Homeland Infrastructure Foundation-Level Data portal.
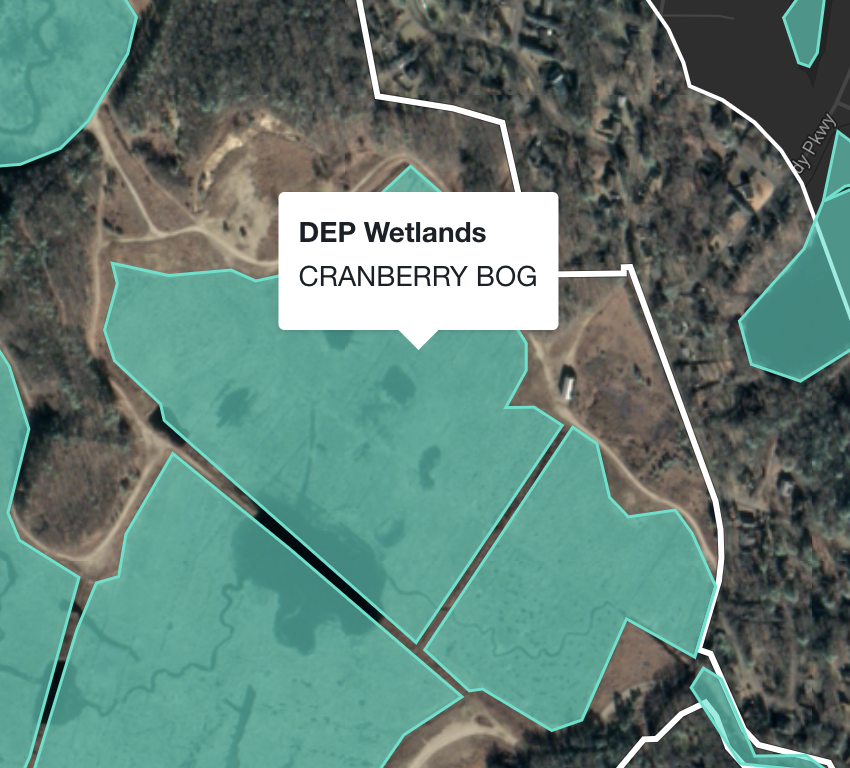
- Massachusetts Wetlands Inventory: The National Wetland Inventory (NWI) is a comprehensive geospatial database maintained by the United States Fish and Wildlife Service (USFWS) that provides detailed information on the location, extent, type, and condition of wetlands across the United States. The Wetlands Data Layer is the product of over 45 years of work by the National Wetlands Inventory (NWI) and its collaborators and currently contains more than 35 million wetland and deepwater features. Massachusetts wetland areas have been updated between 1975 and 2013, depending on the part of the state.

Viewing overlays on the map
To view or hide overlays, click on the relevant layers from the “Change Overlays & Basemaps” button in the right sidebar to select or unselect each one. Overlays can be set to be visible or hidden by default via the settings icon on the overlay. These appearance preferences will be applied the next time you load a property in the portfolio.
You can also set your colors and fill preferences by clicking on the colorful polygon next to each overlay, as shown below.
You can click on an overlay feature so that the hover information remains, allowing you to copy and paste this information. You can click the feature a second time to un-stick the information and freely hover over other overlay features.

Adding custom overlays
Areas of interest such as building envelopes, timber areas, trails, etc. can be added to your portfolio as custom overlays on your properties. These vector data can be points, lines, or polygons.
To add your overlays to Lens, we require shapefiles to follow these guidelines:
- One shapefile per overlay type. This means that if you need to add building envelopes and trails (two separate overlay types), you will need to provide two separate shapefiles. Each overlay can cover multiple properties within the same portfolio
- The shapefile must have a valid projection (WGS 84 projection preferred).
- The property boundaries must have no self-intersections or invalid geometries.
- Include only 2 dimensional coordinates - see this resource if you need help removing a "z" coordinate.
- The overlay file must contain fewer than 1000 features.
You can upload overlays to your Lens account via the Overlay Uploader, which can be accessed from the overlays library settings page.

Once you click "Add Custom Overlay", you'll be prompted to select a file that meets the format criteria above. Once you've selected a file, you can edit the name of the overlay and choose an attribute to appear on hover.

Once you confirm the upload, you'll be sent to the overlay library page where you can select which portfolios the overlay should appear on. Further customization of the overlay's appearance will take place on the map page, as elaborated on in the above section. You can download your custom overlays from the overlay library page.
In the image below, the overlay name is "DEP Wetland" and the name of the attribute displayed on hover is "Cranberry bog".
Updating overlays
To update an existing overlay in Lens, you can delete the outdated overlay and re-upload a current one.